the one thing Namebio doesn't capture very well are sales to end users. none of my end user sales are reported as they are done through non reporting market places, buy now pricing or private sales.
namebio does a very good job capturing auction sales - usually to resellers and investors.
Yea, obviously we can't capture sales that happened in private, and weren't reported by the venue or one of the parties involved. People should feel free to email us screenshots though, we're happy to add your private sales. Just takes a second to send it and helps everyone else quite a bit. A majority of sales in our database are wholesale, but there are lots of retail records from Uniregistry, Sedo, DomainMarket, etc.
sure. but there's no ground for assuming that % of unreported sales was lower in 2017 vs 2016 vs 2015. hence the trend is clearly downhill.
i'd even call it a collapse
")
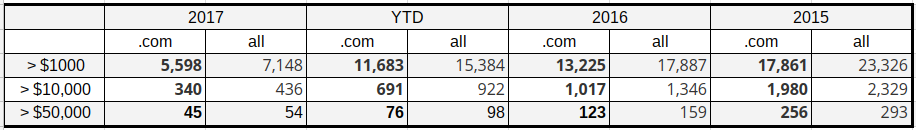
lets take $10K+ .com sales:
387 in the last 12 month vs
1,281 in 2015 =
70% drop (!)
looks quite alarming to me...
I don't think you searched correctly, those numbers aren't right for sales $10k+. Past year is 910 sales not 387, you might have searched just 2017 although your number seems too low for that as well.
2017: 437 (extrapolated out would be 979 - but probably higher as start to the year is slower)
2016: 1,346
2015: 2,329
2014: 1,220
2013: 1,354
2012: 1,414
Total dollar volume of $10k+ sales is:
2017: $23,899,664 (extrapolated to $53,517,652)
2016: $54,013,113
2015: $94,212,855
2014: $65,763,226
2013: $53,763,852
2012: $46,344,736
So 2015 was a banner year as we all know due to the Chinese market, which also bled a little into 2016, but all the other years are pretty close to each other. Many people were cashing out at the top so sales were more frequent, which is why both quantity and dollar volume were almost double in 2015. The correction leveled out some time ago though.
Now people are bag holding domains they overpaid for in late 2015 and early 2016 so sales are less frequent, but the dollar volume is still in line with previous years and average price of $10k+ sales are actually higher this year (even compared to 2015). It's just that less people are willing to sell and actually realize the loss, not an alarming sign of a crash.