Thanks @Bob Hawkes for his analysis here
Domain Sales Strong in First Half of 2019
but I would just like to say the opposite
and here's why:
1. By taking data for 2019 vs 2018 you are effectively implying that there's no significant seasonal difference between 1st and 2nd half of a year.
Let's just check if that's really the case.
We have 197 days passed in 2019 - 54% out of 365 past days of a year time frame.
Let's take a look a the data:
No. of sales: 58,871
Volume $Mil: 88.3
For the whole past 365 days:
No. of sales: 96,063
Volume $Mil: 131.6
So for 54% of days there were
61% of sales
67% of volume
which makes it obvious that the seasonal factor is important and should not be left out.
That means we must take the same time frame for the comparisons.
We have to consider the data for Past Year vs 2018 (365 days each) for our stats to be correct and valid.
2. Bob used the data for all sales that Namebio reports.
Meaning he took into account, for example, the sales in $xxx range.
Those are mostly domainer to domainer sales on different platforms, Godaddy expired actions, Namejet/Dropcach etc. Not real end-user sales.
Yes, there are end-user sales below $1000 of course.
But if we are talking serious domaining-for-money those are just not worth spending half of your life on Namepros forums")
What we are probably need to be interested in and concentrated on are the sales that let us make real money out of the domaining business - $1,000+ sales.
Let quickly check if low value sales have any significant effect (past 365 days):
No. of below $1,000 sales: 82,175 = 85%
Volume $Mil: 23.5 = 18%
As you can see, 85% of sales (that are below $1,000) generated only 18% of volume. So if we exclude them the stats might change drastically.
Hence the lower limit I will enforce for the purpose of this research: $1,000
3. We also want to put a limit on the upper end too as the outliers like $30M sales do not really represent the market, they are exceptions that don't matter much to the market or to us.
Let's be sane and limit ourselves to some reasonable figure.
I will just voluntarily pick $50,000 for that purpose, but you can choose another one and compile your own stats
As for the stats:
In the past 365 days there were 138 $50K+ sales representing 0.14% of total sales.
The volume was $53.8M which is 41% of total sales volume.
Quick example on how outliers affect the stats:
Total sales volume for the past 365 days is $131.6M
For 2018 it was $109.7M
Wow, how nice, the market is advancing at a fast pace isn't?
No, you are wrong!
Just note that the greater figure includes $30M Voice.com sale,
while the biggest sale in 2018 was ice.com at mere $3.5M
Exclude that bigger sale and you got $101.6M in the past year vs $109.7M in 2018 = that's a noticeable decline now
That's where Bob's math does not work
So, excluding the outliers will undoubtedly make our final results closer to real trends and let us see the things as they are.
And we'll hopefully get a more real and detailed picture of the $1,000-$50,000 market segment where domainers mostly operate and make money.
Which is what we ultimately want to accomplish here.
------------------------------------------------
Ok, enough said, let's see
the stats:
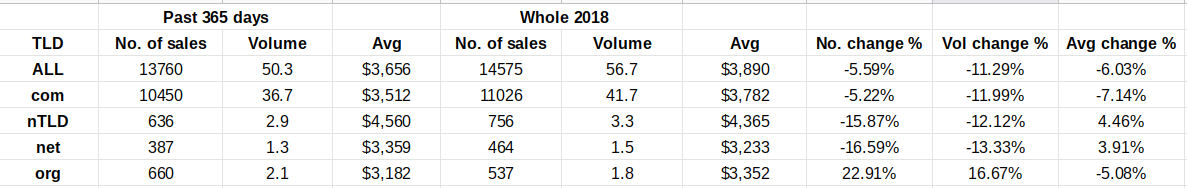
and
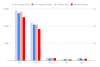
the chart:

Now, you are prepared enough to make your own conclusions...
Do you see what I see?
Exactly that: Where's the Strong Sales, Bob??
Feel free to post you assessments.
Best,
4pm
Domain Sales Strong in First Half of 2019
but I would just like to say the opposite
and here's why:
1. By taking data for 2019 vs 2018 you are effectively implying that there's no significant seasonal difference between 1st and 2nd half of a year.
Let's just check if that's really the case.
We have 197 days passed in 2019 - 54% out of 365 past days of a year time frame.
Let's take a look a the data:
No. of sales: 58,871
Volume $Mil: 88.3
For the whole past 365 days:
No. of sales: 96,063
Volume $Mil: 131.6
So for 54% of days there were
61% of sales
67% of volume
which makes it obvious that the seasonal factor is important and should not be left out.
That means we must take the same time frame for the comparisons.
We have to consider the data for Past Year vs 2018 (365 days each) for our stats to be correct and valid.
2. Bob used the data for all sales that Namebio reports.
Meaning he took into account, for example, the sales in $xxx range.
Those are mostly domainer to domainer sales on different platforms, Godaddy expired actions, Namejet/Dropcach etc. Not real end-user sales.
Yes, there are end-user sales below $1000 of course.
But if we are talking serious domaining-for-money those are just not worth spending half of your life on Namepros forums
What we are probably need to be interested in and concentrated on are the sales that let us make real money out of the domaining business - $1,000+ sales.
Let quickly check if low value sales have any significant effect (past 365 days):
No. of below $1,000 sales: 82,175 = 85%
Volume $Mil: 23.5 = 18%
As you can see, 85% of sales (that are below $1,000) generated only 18% of volume. So if we exclude them the stats might change drastically.
Hence the lower limit I will enforce for the purpose of this research: $1,000
3. We also want to put a limit on the upper end too as the outliers like $30M sales do not really represent the market, they are exceptions that don't matter much to the market or to us.
Let's be sane and limit ourselves to some reasonable figure.
I will just voluntarily pick $50,000 for that purpose, but you can choose another one and compile your own stats
As for the stats:
In the past 365 days there were 138 $50K+ sales representing 0.14% of total sales.
The volume was $53.8M which is 41% of total sales volume.
Quick example on how outliers affect the stats:
Total sales volume for the past 365 days is $131.6M
For 2018 it was $109.7M
Wow, how nice, the market is advancing at a fast pace isn't?
No, you are wrong!
Just note that the greater figure includes $30M Voice.com sale,
while the biggest sale in 2018 was ice.com at mere $3.5M
Exclude that bigger sale and you got $101.6M in the past year vs $109.7M in 2018 = that's a noticeable decline now
That's where Bob's math does not work
So, excluding the outliers will undoubtedly make our final results closer to real trends and let us see the things as they are.
And we'll hopefully get a more real and detailed picture of the $1,000-$50,000 market segment where domainers mostly operate and make money.
Which is what we ultimately want to accomplish here.
------------------------------------------------
Ok, enough said, let's see
the stats:
and
the chart:
Now, you are prepared enough to make your own conclusions...
Do you see what I see?
Exactly that: Where's the Strong Sales, Bob??
Feel free to post you assessments.
Best,
4pm